Education in 2015 Visualized
Some of the most important issues of the year, from school discipline in elementary schools to students saddled with debt long after graduation.
Education issues can be difficult to grasp; they can feel overwhelming, intangible, or even irrelevant. Sometimes, the best and most effective means of conveying education stories are through charts, graphics, images, and videos. Here are some of the visuals from around the Internet this past year that helped visualize what mattered—student debt, early-childhood education, regional inequality in schools, campus protests, and so on—in a way that was engaging and provocative.
School Discipline:
When Schools Are Forced to Practice Race-Based Discipline | The Atlantic
According to U.S. Department of Education’s Civil Rights Data Collection, white students made up the largest percentage of one-time suspensions and expulsions, but black students were expelled and suspended at rates three times higher than their white peers. Education Next polled 4,000 people and concluded that a higher percentage of white respondents, teachers, the general public, and parents opposed federal discipline policies set to correct disparate-impact policies.
Regional Inequality:
Countries With The Most Students For Each School Computer | Forbes / Statista
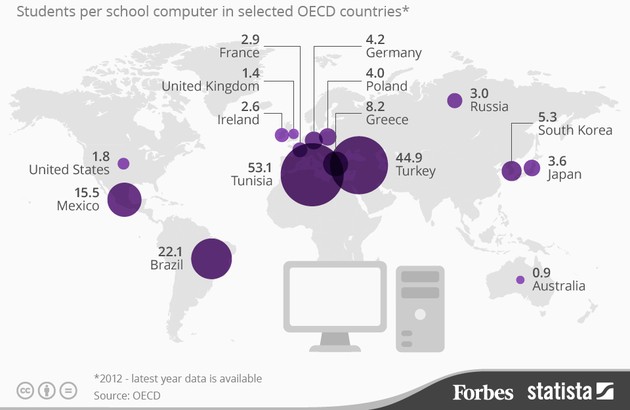
The “digital divide”—the gap between regions that have access to modern technology as a tool, and those that don’t—is a growing problem that hinders how schools around the world are able to educate students. A report by OECD reported that some countries claim to have multiple computers available per student at school, but this does not translate to “appreciable improvements in student achievement in reading, mathematics or science in the countries that had invested heavily in ICT (Information and Communications Technology) for education.”
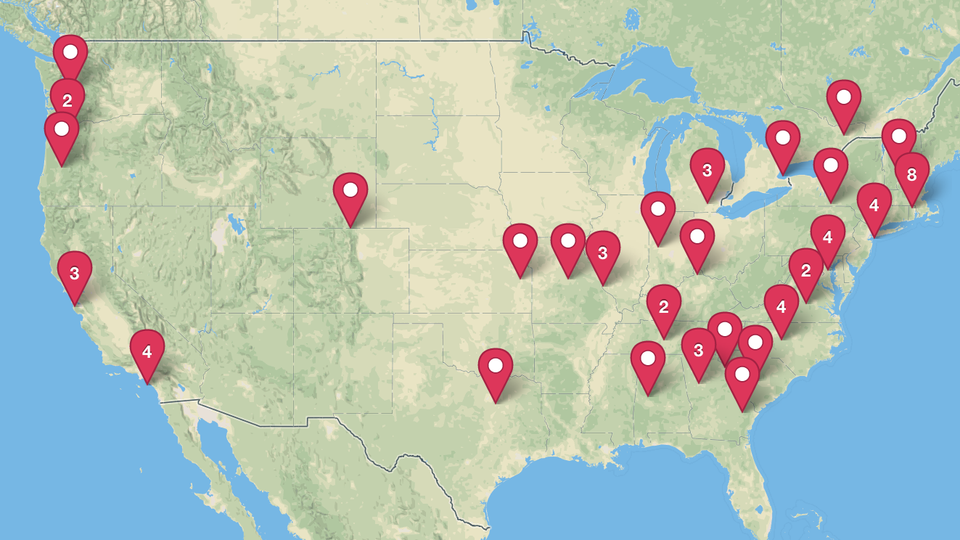
In the U.S., the quality of public education is heavily determined by where a family lives. Lower-income families sometimes live in areas of concentrated poverty. School districts often receive funding from local property taxes, and without the funding generated by large income taxes from residents, barriers limit low-income students’ access to well-funded schools close to their homes. This map shows a system where community wealth and school budgets are inextricably linked: “School districts [are] drawn in odd shapes and sizes, many sitting next to—or even inside of—districts of wildly different means.”
Teacher Diversity:
More Minority Students, Fewer Teachers of Color | The Atlantic
As the student population grows more diverse—with minority students slated to outnumber their white counterparts by 2022—the Albert Shanker Institute, a think tank funded by the American Federation of Teachers, noted that the number of black teachers dropped from 2002 to 2012. The report looks at nine major cities—Boston, Chicago, Cleveland, Los Angeles, New Orleans, New York, Philadelphia, San Francisco and Washington, D.C.—to quantify the drop in teachers despite the presence of more students of color.
Early-Childhood Education:
Playground | James P. Mollison