An Eye on the Records
The Bill James Theory of Winning Baseball
BY MICHAEL LENEHAN
SO the MUCH eight OF and BASEBALL nine-dollar IS seats. INVISIBLE, What EVEN one can FROM see happening “between the white lines,” as they say, is only a portion of what one must know in order to follow the game and understand its little complexities.
I know, for example—as does virtually every baseball fan alive—that George Brett, the third baseman of the Kansas City Royals, is a much better hitter than Bobby Grich, the second baseman of the California Angels. How do I know? Certainly not from watching them bat. Each plays no more than seven games a year in my city, and I am lucky if I manage to see more than one of those games. But even if I could watch the two playing side by side for an entire season, the difference between them—a total of 34 base hits in 1982, or slightly more than one hit a week— would probably escape my notice. I know that Brett is the better hitter only because I know that in his major-league career (through 1982), he collected 1,532 base hits in 4,843 at bats, for a batting average of .316, well above the benchmark figure that separates excellent hitters from the rest. Grich, in 5,348 at bats, made 1,427 hits, for an average of .267—adequate, but nothing special. Brett’s superior reputation, like most in baseball, is rooted in the records.
Does that reputation mean that Brett is more valuable to his team than Grich is to his? Most of the things I can observe directly tell me yes. A third baseman needs a stronger arm than a second baseman does, because he usually has a longer throw to first. He needs quicker reflexes, because he stands closer to home plate and directly in a right-handed pull hitter’s line of fire. He must be able to charge a bunted ball, snatch it bare-handed, and contort his body like an acrobat to throw in one direction while his momentum carries him in another. True, the second baseman must do something similar to turn the double play—a tricky maneuver, to be sure—but that is the most difficult part of the job, and it does not seem terribly difficult compared with the tasks required of third basemen, who always seem to be launching themselves into midair, intercepting the paths of speeding rockets, and rising with impassive faces from clouds of dust, nonchalantly flipping tamed baseballs to their astonished and grateful teammates.
Isn’t a player who can do all that, and hit over .300 besides, more valuable than an offensively “adequate" second baseman? Not necessarily. Appearances notwithstanding, a considerable amount of off-field evidence suggests that second base is in fact the harder position to play. The statistics in my Sunday paper tell me that third basemen are often sluggers, while second basemen rarely are. If I assume that managers know what they’re doing when they choose their players, I must also assume that the pool from which third basemen come is larger—and thus contains more good hitters—than the pool from which second basemen come, and I must deduce from this that the skills required at second base are more unusual than those required at the “hot corner.” Evidently, the double play is harder than it looks. In any case, a second baseman who bats .267 can be just as valuable to his team as a third baseman who bats .316. Nearly every sophisticated follower of baseball knows this as truth; yet, again, without the records, the truth would be invisible.
In an intuitive way, I have probably known about the invisibility of baseball since I first read a line of numbers on the back of a bubble-gum card. I was not conscious of it, however, until a friend gave me a copy of The Bill James Baseball Abstract, “the thinking man’s guide to baseball.” James is young for a sage—thirty-three, “one day younger than John Wathan,” of the Kansas City Royals—but since publishing the first annual Abstract, in 1977, he has taught much to many fans of the game. That first book—sixtyeight typewritten, number-laden, photocopied, stapled-together pages—was sold, through small notices in the Baseball Bulletin and The Sporting News, to about seventy hard-core aficionados of baseball records and statistics; each copy was shipped from James’s home with a personal note and a money-back guarantee. The 1982 and 1983 editions, with more prose and fewer numbers, were published by Ballantine Books, which to date has printed some 150,000 copies in all. Together the seven books make a convincing case that we can see baseball more clearly if we keep one eye on the records.
ALLOW ME, PLEASE, TO READ TO YOU FROM THE 1983 edition. James is comparing the Houston Astrodome, a large, indoor stadium, where the air is thick and home runs are rare, to Boston’s Fenway Park, the best hitter’s park in the big leagues:
. . . the Astrodome is the one park in baseball in which you simply cannot play long-ball successfully, and this takes the game back to the way it was played long, long ago. The bunt, the hit and run, the squeeze play... in the absence of more powerful weapons, these subtle plays attain a huge significance. . . .
As the mountains make Wyoming folk rugged and the cities make city folk guarded or defensive, this environment, too, shapes the character of its inhabitants. It has always been my feeling that the cliquishness of the Boston Red Sox, their surliness and impatience with the press . . . was the Curse of Fenway, that it owed its origins to a long-dead architect. An absurd theory? So it sounds, but hear me out. Fenway makes ballplayers look like better hitters than they are. That inflates egos. Inflated egos cause resentment, in particular among those not favored by the park: the team divides into clusters of the favored and the ill-favored.
The Astrodome is a negative image of Fenway, an exactly opposite park in almost every way one can imagine. Beautiful, ugly. Quaint, modern. Vibrant, sterile. Cozy, spacious. Hitter’s heaven, hitter’s nightmare. And for what were the Astro players of the fine teams of 1978 to 1981 known? Their openness with the press, their closeness and almost familv-like atmosphere. Odd, isn’t it? As the park knocks 20 points off every player’s average, it humbles hitters and it controls egos.
But even more than that, it is my feeling that the mere fact that in Fenway a hitter can create runs by his own actions tends to cause Fenway teams to pull apart over time. A key fact about the Astrodome is that it takes three players to make a run. In order to do your job in this park, you have got to see yourself as part of a plan, a cog in a machine. . . .
In Fenway, the longer the players stay together, the more stale and lifeless they become. Fresh talent is constantly needed. After they have a good year or two, they forget all about playing together. Take a look at the teams that have been successful in Fenway Park. The 1975 Red Sox, the last champion, were led by two rookies (Lynn and Rice), and featured prominently a whole list of new and almost-new faces: Rick Burleson, Dwight Evans, Denny Doyle, Cecil Cooper, Rick Wise. The 1975 Red Sox finished 2nd in the league in sacrifice hits, 1st in sac flies.
But the longer this collection of players stayed together, the worse they got. Perhaps it is only a coincidence . . . but they dropped to 10th in the league in sacrifice hits in 1976 and 12th in 77.
Now look at the last Red Sox champion before that, the 1967 team. Again: a lot of new faces on the team (in fact, it was the youngest lineup ever to win an American League flag. Six regulars were 24 or younger). Again: they finished second in the league in sac hits (they had 85: California had 88) and second in sac flies. Again: the next year they stopped doing these things (fourth in sac hits, sixth in sac flies). Again: the longer the team stayed together, the worse they played.
To my mind, this is the sort of thinking and writing that has brought James forward from the back pages of The Sporting News to the feature pages of Esquire (to which he contributes a yearly baseball preview) and Sports Illustrated (where he has been both author and subject). The bulk of his work, however, is probably better represented by the passage below, also from the 1983 Abstract, which is a little less speculative and more firmly grounded in statistics. It is James’s reaction to a comment by Tony Kubek, the NBC announcer and former New York Yankees shortstop, who is a vehement opponent of the American League’s designated-hitter, or DH, rule. Under this rule, the pitcher does not bat; his place in the batting order is taken by a designated hitter. One effect of this is that the pitcher can stay in the game longer than he could otherwise. In the National League, where the DH rule is not allowed, starting pitchers are often removed for pinch hitters relatively early in the game.
The DH rule is now supposed to be doing something else to pitchers. Tony Kubek is convinced that the DH rule is ruining pitchers’ arms. . . .
One way that we can study this issue is by looking at the turnover in starting pitchers in the two leagues. If Kubek is right, if the DH rule is ruining pitchers’ arms, then if we draw up lists of the pitchers who pitch 200 innings in each league, the names of the AL pitchers should have less of a tendency to repeat on the list than do the NL pitchers. We can provide an insight into the general question by breaking it down into a lot of smaller but more specific questions, such as: Of all American League pitchers who pitch 200 innings in a season, what percentage will pitch 200 innings again three years later? Four years later? One year later? How about the National League pitchers?
Well, I have done these studies, and Kubek apparently has a point. The rate of season-to-season turnover of 200innings pitchers is consistently higher in the American League than it is in the National, by a margin that certainly appears to be significant. . . .
To pick one item from the chart: if a National League pitcher pitches 200 innings in a season, the chance that he will also pitch 200 innings in a season five years later is 38%. But if an American League pitcher pitches 200 innings in a season, the chance that he will pitch 200 innings in a season five years later is only 23%. . . .
This sort of analysis is Bill James’s stock-in-trade. Time after time in the Abstracts, he takes up a nugget of baseball wisdom—an announcer’s offhand comment, a manager’s solemnly stated conviction, one of the old saws that abound in the folklore of the game—and tests it against the record to see if it is true. In the 1979 Abstract, responding to a Pittsburgh sportsvriter’s assertion that the Pirates slugger Dave Parker is not susceptible to batting slumps, James published three years’ worth of month-bymonth batting averages to show that Parker’s performance at the plate had always varied widely—he hit .413 in May of 1976, .220 in June, and .376 in July. In 1981, James scrutinized the popular notion that Reggie Jackson, one of the game’s greatest talents and biggest egos, performed better in front of large crowds than in front of small ones; according to James’s analysis of batting statistics and attendance figures, Jackson hit much better before small crowds of 10,000 to 20,000 (though in 1982, as James reports, Jackson reversed the trend). In the 1982 Abstract, James considers the common conception that a baseball player’s prime comes between the ages of twenty-eight and thirty-two, a truism often attributed to Stan Musial. In a long essay studded with charts and graphs, James makes a compelling case that most players’ true primes come between the ages of twenty-five and twenty-nine; Musial himself, he points out, won three Most Valuable Player awards in his career, the last when he was twentyseven years old.
James also takes on bigger ideas, more deeply ingrained assumptions. Throughout the history of the Abstract, for example, he has consistently challenged one of the fundamental notions of traditional baseball record-keeping— that a player’s defensive ability is indicated by the number of errors he makes (or by his fielding average: number of errorless plays divided by number of chances). The error, James contends, is an anomaly among sporting statistics, a record not of an event but of an opinion—the official scorer’s opinion that a player should have made a certain play. No error is charged to the shortstop who is so slow of foot that he can’t get near a batted ball in the first place: but the shortstop who gets close enough to touch it, or was smart enough to be standing directly in its path to begin with, can be charged with an error if he fails to complete the play. James argues eloquently that this reasoning perverts the reality of the game: the object is not to catch all balls that come close enough to cause embarrassment but to catch as many balls as possible. Imagine a game in which six ground balls are hit between second and third base. Shortstop A fields four of them flawlessly, but watches as the other two pass by beyond his reach. On the same six ground balls, Shortstop B fields the first five, and lets the sixth bounce off his shin. Which has done better for his team? Yet which has the “perfect” fielding average of 1.000? James has devised a statistic he calls “range factor,”which is simply a count of all the successful plays a defensive player makes per game. In the example above. Shortstop A would have a range factor of 4, Shortstop B a range factor of 5. This is a more accurate—and more objective— way of expressing their respective abilities and value.
Range factors are not figured by the keepers of baseball’s official records. Neither are month-to-month batting averages, age/performance profiles, or hitting statistics as a function of crowd size. But all the information needed to calculate these things is available in the records, and in the box scores carried nearly every day by nearly every newspaper in the country. Baseball must be unique in this regard: on the one hand, it is rife with the hokum of oral tradition—impromptu analysis, automatic opinion, and institutionalized assumptions that are passed without question from pundit to pundit, generation to generation. On the other hand, the game is so well documented that virtually any statement about it can be measured against objective fact: as James has written, “A baseball field is so covered with statistics that nothing can happen there without leaving its tracks in the records.”The late Casey Stengel may have been referring to this phenomenon (it’s hard to tell with Casey Stengel) when he assured sportswriters, “You could look it up.” One of the great contradictions of baseball is that Bill James is making his living looking it up; very few before him have taken the trouble.
JAMES AND HIS WIFE, SUSAN MCCARTHY—A RADIANT, redheaded artist who is known as Susie to readers of the Abstract—live in the tiny town of Winchester, Kansas, about an hour’s drive west of the Kansas City Royals’ ball park, in a fourteen-room house with a pink and agreeably ramshackle exterior. I visited them there last spring, and found James dressed in a T-shirt, corduroy pants, and a red bathrobe whose synthetic fuzz was beginning to wear through in a couple of spots. He is tall and meaty, with a dark beard and a vaguely bowl-shaped haircut. In his “office,” a wallpapered room lighted by a chandelier-like fixture, a Rolling Stones record was playing on a buzzy stereo system. Instead of the home computer that I expected to find, I saw stacks of old newspapers, mostly VSA Today and Spoiling News, both of which James saves for their box scores—the heart of his data-storage system.
On his desk—along with a half-empty bag of almonds, a flyswatter, a nine-inch-tall glass of Diet Pepsi, and myriad other objects—James had a spiral-bound notebook and a copy of The Baseball Encyclopedia opened to a page bearing the lifetime batting statistics of Luke Appling, the great Chicago White Sox shortstop of the thirties and forties. Someday, James explained, he hopes to publish a book on famous players of the past, and toward that end he was running Appling’s record through a couple of the formulas he has invented to help him analyze baseball statistics. One of these is the “runs-created” formula, introduced by James in the 1978 Abstract.
The runs-created formula is essentially a mathematical model of baseball offense, a tool for predicting, in an abstract way, how many runs a team will score given its number of walks, singles, doubles, and so on over the course of a few games, a month, or an entire season. As a practical matter, of course, one can count these things from the records: abstraction needn’t enter into the picture. The value of the formula is theoretical, and basically twofold. First, it expresses the relationship between runs and the various offensive events that produce runs—singles, home runs, etc. It thus enables one to answer questions like: If Team A draws 20 percent more walks this year than it did last year, how many more runs will result? If Team B replaces a player who hit 160 singles and 10 home runs with a player who can hit only 100 singles but 30 home runs, will its run production improve?
The second advantage of the runs-created formula—and the more important one in James’s work—is that it can be applied to players as well as to teams, and thus it provides a way of measuring an individual’s contribution to the complex team machinery that is a baseball offense—a task for which traditional baseball records are inadequate. In 1982, for example, Robin Yount, the American League’s Most Valuable Player, achieved a batting average of .331; though that number may speak volumes about Yount’s ability as a hitter, it says little about his contribution to the Milwaukee Brewers’ offense, because the point of the game is not to attain a high batting average but to score runs and win games. (Bill Buckner hit .306 for the Cubs in 1982, and look where it got them.) One can learn a little more about Yount’s contribution by noting that he batted in 114 runs, but this number is only slightly more helpful, because it depends on how many of Yount’s teammates had reached base—and were thus available to be driven in— each time he stepped to the plate. Similarly, Yount himself scored 129 runs, but here he was relying on the batters who followed him in the lineup to drive him home. The runs-created formula serves to isolate Yount’s performance from that of his team; it gives an estimated answer to what is perhaps the most important question that can be asked about any player: Of all the runs scored by the team, how many can be attributed to this player alone? How many runs would the team have scored if he’d broken his ankle the first day of the season?
The basic formula is:
Runs created - (hits + walks) (total bases) (at bats + walks)
The two elements of the numerator, James says, represent the two essential goals of a baseball offense: getting on base (hits and walks), and advancing base runners toward home plate (total bases, the number of bases achieved through hits; a double equals two total bases, a home run four). The denominator represents plate appearances— the number of tries that the player took to produce the activity expressed in the numerator. (Walks are added to at bats because in official baseball records, a base on balls does not count as an at bat.)
Running Robin Yount’s statistics through this equation, James calculates that Yount “created" 141 runs for Milwaukee in 1982. Repeating the calculation for each player on the team and adding the results together, he comes up with a total of 880 runs for the Brewers. These numbers, remember, are only theoretical estimates ol how many runs should have been produced by the given numbers of hits and walks. In the case of the team, however, the model can be checked against the events of the real world. The official records tell us that the Brewers actually scored 891 runs in 1982. James points to this close match ol theory and reality as proof of his formula’s validity. He struggled with quite a few less-valid equations before coming up with this one, and he is still tinkering.
“The process of searching for the runs-created formula took—well, I guess to some extent it’s still going on. But there was about a year and a half there where I was working very hard looking for something like this.”Originally, James told me, he tried adding together the elements ol offense, adjusting each one with a coefficient to make the formulas’ results jibe with the actual records. “I started with all sorts of things, like 1.62 home runs, plus 1.03 triples, plus 0.76 doubles, plus 0.5 singles, plus so much for a walk. A lot of people tried to do this.” (James is speaking here of a handful of baseball statisticians, some professionals and some hobbyists, who correspond via telephone, mail, and, occasionally, obscure publications. He calls them—and himself—“sabermetricians,” in honor of the Society for American Baseball Research. Not all members of SABR, however, are interested in this kind of statistical analysis.) “And when I first presented my runs-created formula, people would encourage me to do something more like that. The problem with formulas like this is that they are arithmetic relationships rather than geometric relationships, and the way in which offense is combined in a baseball game is really much more of a geometric combination than an arithmetic combination. A home run has a different value in one context than in another"—that is, its worth more when preceded by a hit and a walk than when preceded by two pop flies—“and thus to have an arithmetic, flat value for the home run. to simply add it in, would always result in a total that was too low for a good team and too high for a bad team, because the bad team’s home runs would not be worth as much as they were supposed to be. So I started looking for geometric combinations of offensive incidents that would produce the right results. In short, James multiplied offensive elements rather than adding them; the formula he ultimately hit upon, applied to an entire team over the course of a season, generally gives a result that differs by no more than a few percent from the team’s actual achievement. He has a variant of the formula that takes stolen bases into account, and he usually uses it when the necessary data are available to him, but leaving that data out of the equation does not appreciably impair its accuracy. James finds this interesting, because he is not convinced that base stealing is as important or as useful as the current vogue would indicate; evidently the model agrees with him.
As I sat across the desk from him, James subjected Luke Appling’s career to his runs-created equation, running one hand across The Baseball Encyclopedia and stabbing with the other at a battery-powered calculator whose buttons seemed too small for his fingers. He did a lot of the adding and multiplying in his head, and it took him no more than fifteen minutes to dispatch Appling’s twentyyear major-league career. He may have been going too fast. When I asked him to explain some of the numbers in the spiral notebook to me, he was unable to decipher a figure that he’d written there just a few minutes before.
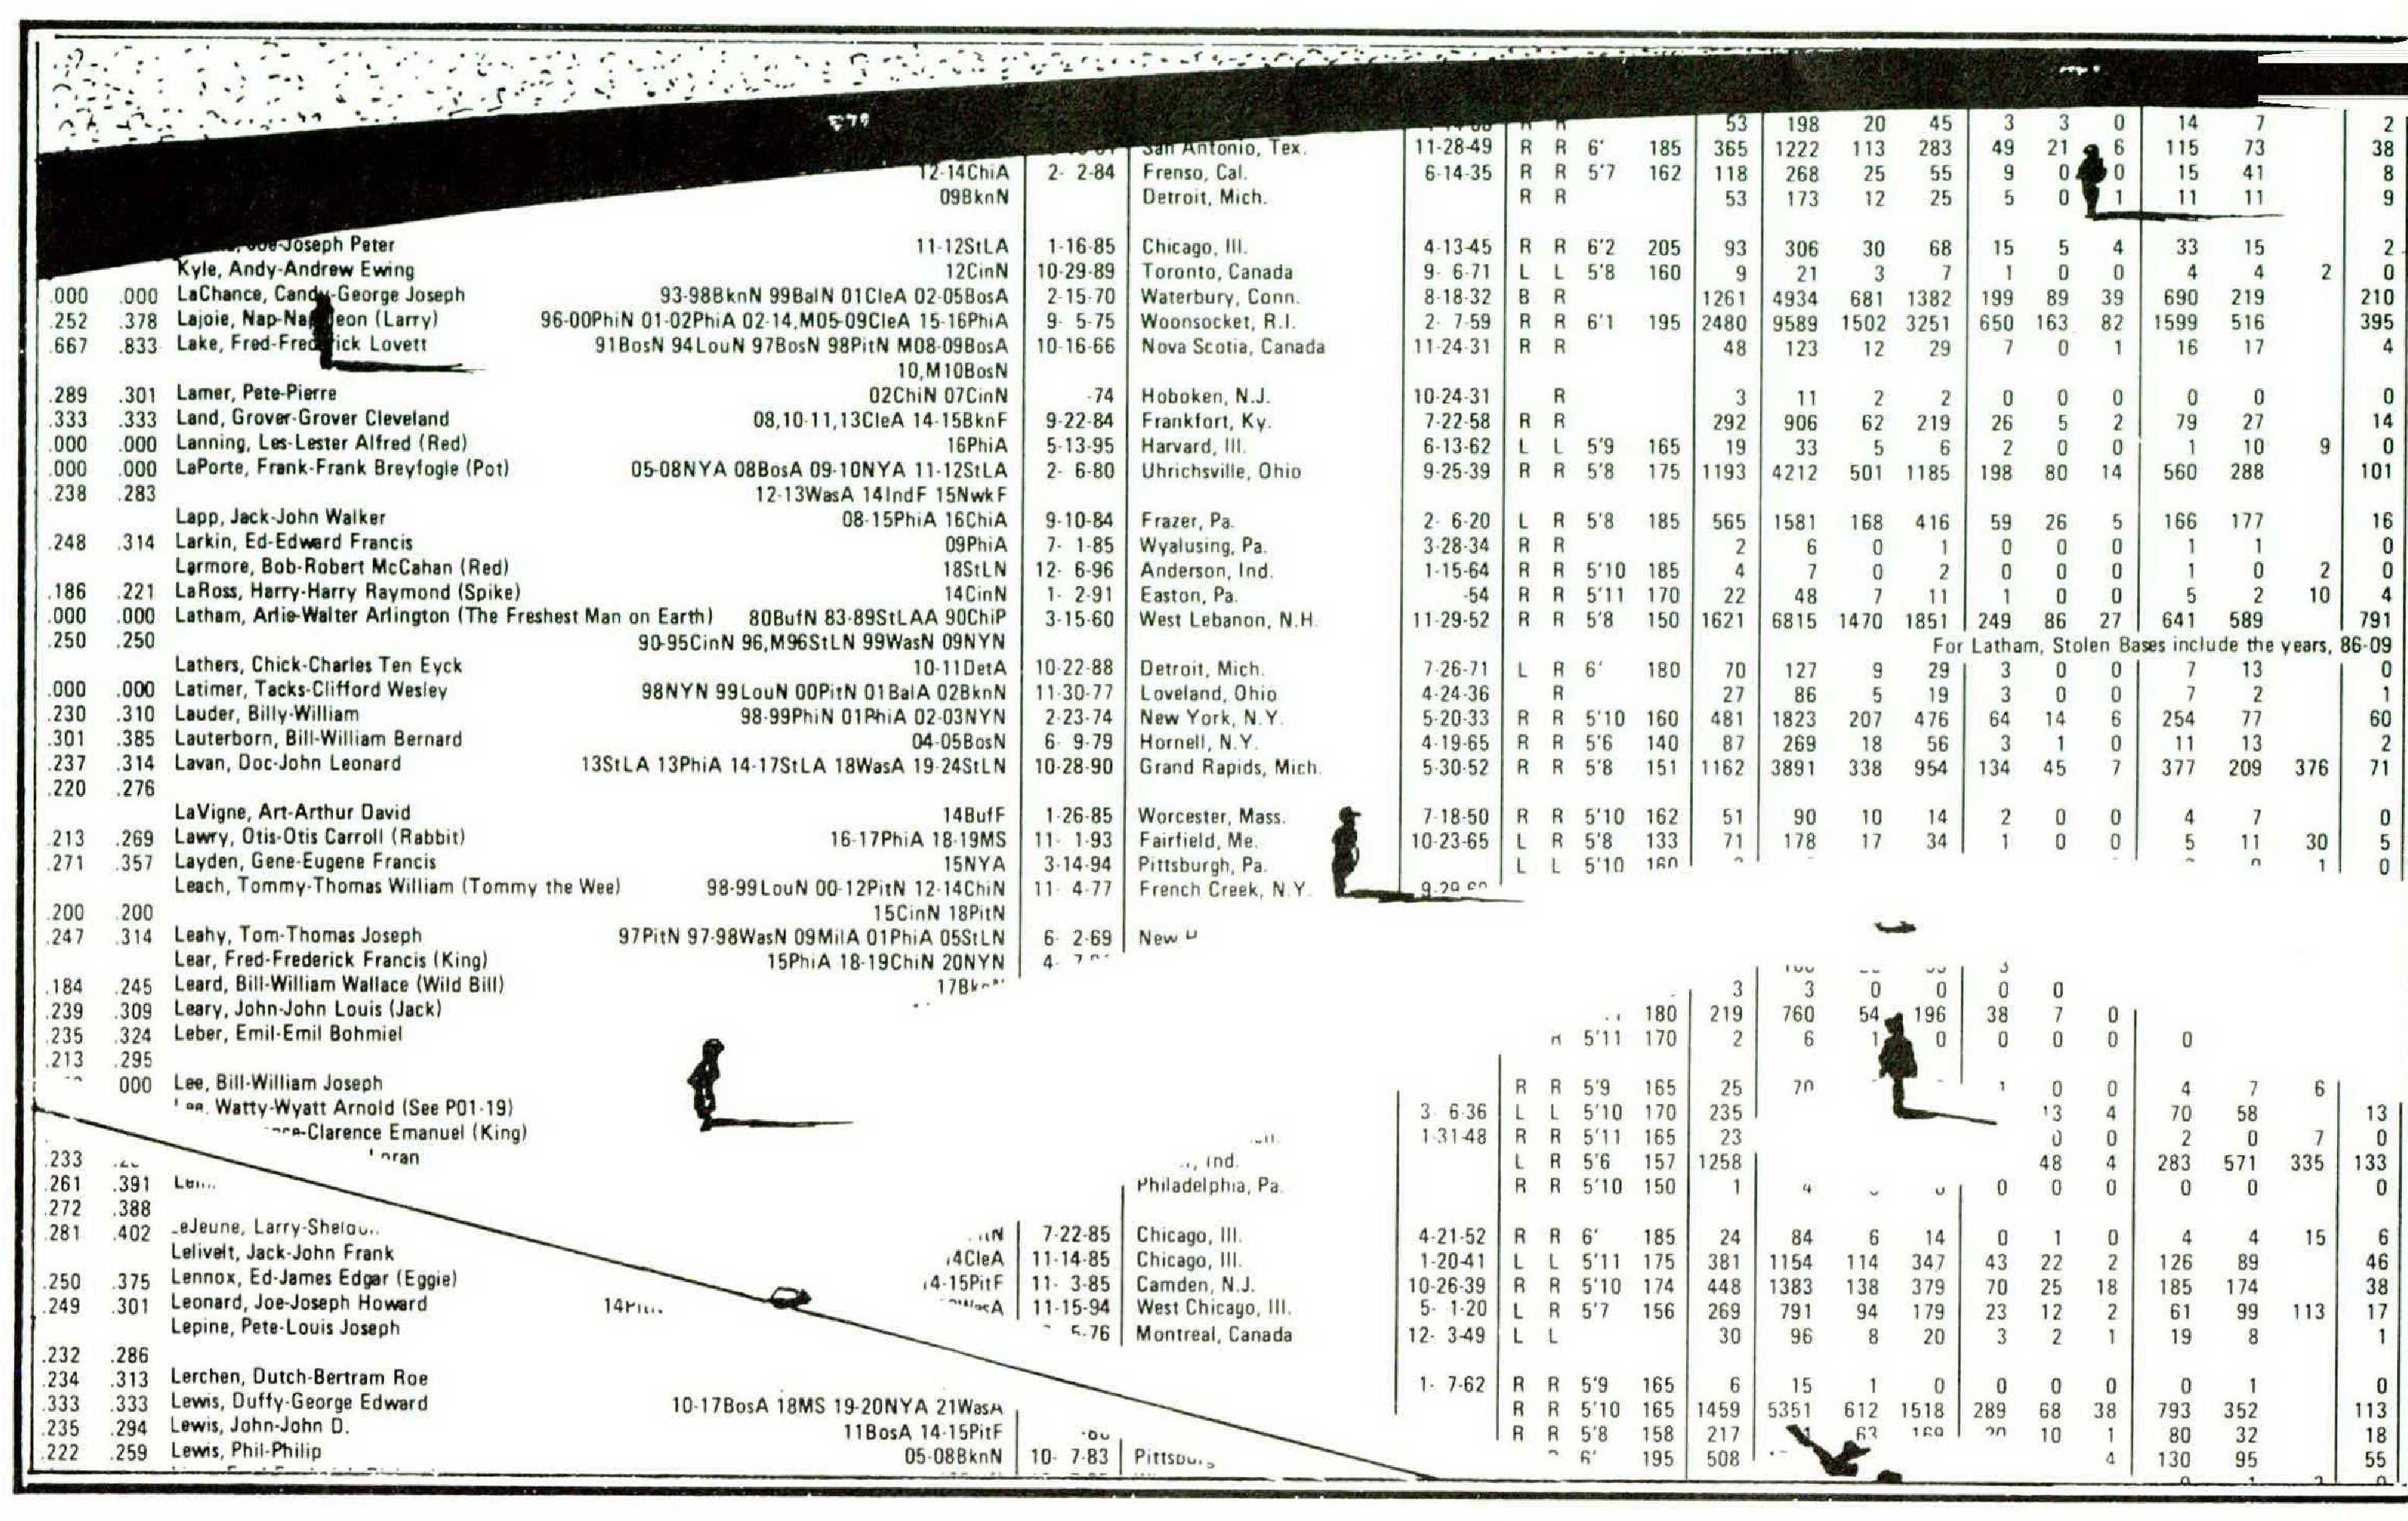
AFTER book and TEARING filing him LUKE in a APPLING cabinet, OUT James OF told THE me NOTEthat he grew up in a small Kansas town called Mayetta, not far from his present home. He was the youngest of six children, he said, and his pursuits were mostly solitary. “I believe that had I grown up in a larger city, I would as likely have grown up fascinated by movies as by baseball. I love the movies now, see everything, regardless of how bad it is—well, that’s not quite true—but in my childhood, a small town, there were no movies, and baseball was the summer’s entertainment.”To James, as to many a midwestern boy, baseball meant the Kansas City As and the St. Louis Cardinals, and radio was the instrument of his connection. “I listened to the A’s, hardly ever missing a game, with a great deal of interest, pacing the floor on the rare occasion when we were in danger of scoring. They were incredibly bad. I was very interested in ways that had nothing to do with numbers, but it’s probably true that my facility with numbers made baseball accessible to me. I was always good at math. I used to do numbers tricks. When I was in college, I remember sitting in a room, sort of an entryway, and people would walk through and say, ‘A hundred and eighty-three divided by six-o-nine,’ and I would divide it in my head and give it to them by the time they walked out the other side of the room. The first strong connection of that with baseball was a stack of Post cards—in 1961. Post came out with a series of 200 baseball cards, and I cut them all off the packages—bought all kinds of cereals that my family refused to eat just to get some of them. I was fascinated by all the records.” James got up from his desk, and within a minute or so, had the stack of baseball cards in his hand. “There’s a Tony Kubek,” he said, offering me a card. “Now, that, to me, is what a baseball card should look like—picture to one side, record on the bottom. Notice the arrangement of the items on the record down there? With the insertion of stolen bases, it’s the same data and basically the same arrangement I use in the Abstract.
“I was always interested in all those things people say. Charlie Finley [who became owner of the A’s in 1960, and moved them to Oakland in 1968] fired his announcers every year, just as he fired everyone else every year, so you would have two new announcers doing the games every year, and they had all of this baseball knowledge, which they repeated year after year, game after game. And I always wondered from whence it came, and how it related to the images of the players that I had.
“I remember hearing one time, when I was maybe a sophomore in high school, a St. Louis announcer talking about—gosh, who was it? I’ll be able to place the date of this exactly if I can figure out who the player was.” With that, James went to his Baseball Encyclopedia, something he did often as we talked. He doesn’t like to leave questions of fact dangling, or to deliver opinions without offering supporting evidence. “This player was a defensive first baseman, no kind of hitter at all, and the announcer made a statement about him, some time around '64 or thereabouts, that he probably saved his team a hit a game, but it was just a question of whether he could hit enough to stay in the lineup. It may have been Ron Fairly”—James looked up from his book at this point—“but that doesn’t sound quite right,” James understood the announcer to be comparing this first baseman, whoever he was, with otherfirst basemen or with an average first baseman—otherwise the comment would be preposterous—and the comparison stirred his curious mind. “It made sense to me that if this player was saving his team one hit a game, then he had the same value that he would have had had he been hitting what he did and getting one extra hit per game, right? I mean one hit defensively equals one hit offensively, even if you don’t assume that baseball is 75 percent defense, which would be another whole avenue of approach. So I simply took the one hit per game and added it to his offensive totals, and figured out that were that true, he would have been hitting four-thirty-something. It seemed to me most remarkable that this man—who was as valuable as he would have been had he been an average defensive player and hitting .430—somehow couldn’t stay in the lineup. I remember writing a letter—probably to The Sporting News. It started out to be a short, one-page letter, but I got carried away showing that this player could not possibly have been saving one hit per game for his team—either that or his team was insane for not playing him—and it ran to many many pages, and I realized that no one would ever pay any attention to it, so I put it away and never did anything with it.”
James studied English and economics at Kansas University. He learned about mathematical modeling techniques in his economics courses, and quickly found w-ays to apply them to baseball. By this time, though, he was inclined to view his obsession with baseball the w-ay some of his friends and relatives viewed it—as an eccentricity at best, and worse, as a shameful waste of time and energy. After graduating, in 1971, he wTas drafted into the Army and sent to Korea, w-here he continued, despite his shame, to receive The Sporting News. Upon returning to Kansas, he obtained teaching certification and tried to apply himself to a useful career, but he lasted only one year as a high school teacher before deciding to give up and give in. He began writing articles and stories—articles about baseball and stories that didn’t sell—and he took work wherever he could find it: at a hamburger joint, at a convenience store, and, for five years, at a Stokely-Van Camp plant in Lawrence, Kansas, first as a night watchman and later as a boiler-room attendant. “I always took that kind of job,” he said. “They didn’t pay anything, but they allowed me to spend an awful lot of time wdth the box scores.”
James said that in his early articles, for such publications as Baseball Digest and Baseball Bulletin, he was able to do the kind of statistics-oriented, analytical waiting that has always interested him most. It wasn’t long, however, before editors began pressing him for baseball reporting that was more conventional. “I became frustrated that I couldn’t do the things I wanted to do, and also aware that I could produce a great many more articles than these magazines could use.” The result of that frustration was, in 1977, the Baseball Abstract, which gradually became a career. James sometimes seems amazed by this turn of events. He told me that his work is “play,” that it is “not very important,” that it is an “idiosyncratic form of entertaining myself. ”
I gathered that it has taken him some time to get used to the idea that he has become respectable—even famous, and materially comfortable besides—pursuing his childhood avocation. “I haven’t worked in the factory for four years now,” he told me when we first met, “and I haven’t even worried about it for one year.”
WHILE I WAS IN KANSAS VISITING WITH JAMES, the team that I follow, the Chicago White Sox, was across the Missouri border, in Kansas City, visiting the Royals in a weekend series. James and Susie took me to a couple of the games. We sat in the six-dollar seats—upper-level boxes—and talked about the people in the more expensive sections, who were well isolated from the riffraff. Susie went for hot dogs, timing her trip so she would return with the food just as the game was beginning. James clapped as each Kansas City player was announced, and he sang the national anthem out loud. He and Susie passed a pair of binoculars back and forth, commenting on this player’s haircut and that one’s facial expression. Before the first game, a Friday-night affair, James spied the White Sox relief pitcher Dennis Lamp on the field and asked if I could think of any other players whose names suggested light. James mentioned Harry Bright, and I chipped in with Wally Moon, but we never did come up with an entire team, although we continued the game for the duration of my stay. When Lorenzo Gray, the Chicago third baseman, stepped in to bat against Vida Blue, the Royals’ pitcher, James pointed out that we were watching a Civil War confrontation.
(In the 1983 Baseball Abstract, discussing the Royals’ Frank White, James wrote: “Did you ever notice that players named ‘White’ are almost always black, and players named ‘Black’ are usually white? ... I suppose that it is the nature of names, as with Peacekeeping Missiles and Security Police, to disguise the truth more often than they reveal it. Horace Speed stole only four bases in his career, Vic Power was a singles hitter, Bill Goodenough was not good enough, and Joe Blong did not belong for long.”)
James recorded the events of the game in one of his spiral notebooks, using a characteristically unconventional and data-packed system of scoring. In the first inning, John Wathan came to bat, and his effort went down in James’s book this way:
Wathan, C B(BA-RF-MD-42-13B) S C B X 53
Translation: The first pitch to Wathan, the Royals’ catcher (c), was a ball (B). The material inside the parentheses encodes the White Sox defense against him: the shortstop and second baseman were back (BA) and swung around to the right (RF); the outfield was medium deep (MD) and also swung toward the right (42 being an expression in degrees of the center fielder’s position relative to the rightfield line); the first and third basemen were playing close to the plate to guard against the bunt (13B). The second pitch to Wathan was a swinging strike (S), the next a called strike (C), the next another ball (B). Finally Wathan hit the ball in fair territory and put it in play (X). It was a ground ball to the third baseman (5), who retired Wathan by throwing him out at first (3).
Wathan came up again in the third, this time with Willie Wilson, the Royals’ lead-off hitter and premier base stealer, on first base. In the 1983 Abstract, James had written that preceding Wathan in the batting order was probably costing Wilson some stolen bases. “Wathan will not take a pitch to allow Willie to steal. . . . Wilson on July 5 [of 19821 had 12 stolen bases, and I swear there must have been 20 times when he had second stolen and Wathan fouled the pitch off. I stress that I am not criticizing John Wathan for this. . . . Wathan is a fastball hitter, and I think the best thing he can do when he sees a fastball is to hit it. But Willie stole a lot more bases late in the season, when [U.L.] Washington was batting second.”On the third pitch of the sequence, Wilson was off for second, and Wathan ruined the attempt with a foul ball.
Thanks to his pitch-by-pitch scoring system, James was able to announce at the end of the fourth inning that Vida Blue had thrown eighty-two pitches, and he predicted that Blue would fail to finish the fifth. With one out in the White Sox fifth, Harold Baines reached first on a hit that looked—as the announcers love to say—like a screaming line drive in the next day’s box score. But in James’s notebook it looked like a bunt: C B X S1.5 BUN. Then Chicago’s designated hitter, Greg Luzinski, engaged Blue in a battle of wills, fouling off nine pitches (exactly) before pummeling a ball over the left-center-field fence. Blue was immediately replaced by the relief pitcher Mike Armstrong (“Great name for a pitcher,” James remarked), but it was too late for the Royals. The Sox went on to win, 9-6.
The next day, we watched on a small black-and-white TV set in James’s office as the Royals took their revenge, 8-4. Wathan was batting ninth in the lineup, instead of behind Wilson, a move that James attributed to the foiled base-stealing attempt of the night before. The game wasn’t much. By the end of the sixth inning, with the Royals comfortably ahead, we had both assumed a posture well known to baseball fans, watching the game out of one eye and relying on changes in the announcer’s drone to tell us when something interesting was happening. I was examining one of James’s notebooks, and he had his nose in The Baseball Encyclopedia. Abruptly, he broke a long silence with a cry of discovery. “Aha!" he called, pointing to his book as I looked up. “Alex Beam!”
FROM THE SEVEN BASEBALL ABSTRACTS THAT I James has published so far, and from the various articles he has written for the popular sporting press, there emerges a set of recurring themes that might be called the Bill James Theory of Winning Baseball. One element of this theory is James’s conviction that the most effective baseball offense is the one characterized by brute power—the home run, the big inning—as opposed to the strategy that seeks to manufacture runs from long sequences of events like singles, bunts, stolen bases, and sacrifice flies. James is particularly unimpressed with the stolen base as an offensive weapon. He and other sabermetricians have tried, with all sorts of studies, to find a correlation between stealing bases and winning games, and they have consistently found that, compared with other offensive elements—homers, hits, on-base percentage, etc.— stolen bases do not seem to count for much. The debate over stolen bases is an old and complicated one, and I cannot do James’s position justice here; the essence of that position, however, is suggested in this excerpt from the 1980 Abstract, where James offers a possible explanation for the stolen base’s honored place in the current baseball consciousness:
Could it be, I wonder, that major league managers—and all of us, to some extent—have been the victims of an unusually persistent illusion? It is created by the contrast between risible gains and invisible, or only partly visible, losses. Omar Moreno singles, he steals second, and then scores on another single. A visible gain; the stolen base has meant a run. BUT—Omar Moreno singles, he is caught stealing. Who knows if he has messed up a fiverun inning? Who knows what the batter who is on deck when the game ends would have done? Did you ever take a score sheet for a game you saw, take out the “caught stealing,” and re-construct the entire game? I have, and I have seen occasions when two runners caught stealingcost the team four runs. It’s a funny feeling, sitting there among 30,000 people and wondering if you are the only one who realizes that. It isn’t obvious in the least.
James and other sabermetricians agree that, in general, a team must succeed in roughly 65 percent of its basestealing attempts before it begins to increase the number of runs it scores. In 1982, major-leaguers stole 3,176 bases in 4,793 tries, for a success rate of 66.3 percent. For this reason and others, James feels that, overall, stolen bases are not contributing a great deal to baseball offense. This does not mean that a manager should refrain from ordering the steal when he is one run down in the eighth inning and has his prime speedster on first with no outs. Most of James’s analysis operates on a level different from that. He would not ordinarily presume to advise a manager in a specific game situation; he might, however, have something to say about the general manager who was loading his roster with jackrabbits and planning a long-term offensive strategy around base stealing: he might say the fellow was incompetent.
Then again, he might not—it would depend on the characteristics of that general manager’s stadium, for a second key element in James’s view of baseball is that ball parks affect the teams that play in them much more than is commonly appreciated. Whereas James thinks that base stealing is important in the Astrodome, where other types of offense are stifled, he would think it ridiculous in Fenway Park, which is the most extreme example of a stadium that favors hitters over pitchers. James has estimated that Fenway’s short left-field wall, its excellent visibility conditions, and its minuscule amount of foul territory (which causes many foul pops to wind up in the seats, rather than in opponents’ gloves) raise batting averages about twenty points overall, and he has calculated that run production is about 13 percent higher there than in other American League stadiums. He points out in the 1983 Abstract that Boston as a team hit .294 in Fenway in 1982, .255 on the road; opponents of the Red Sox hit .285 in Fenway, .266 elsewhere.
A colleague of James’s named Pete Palmer, a Bostonarea resident and a statistician for the Sports Information Center (a private company that compiles official statistics for the American League), has studied the Fenway effect exhaustively and believes it to be so pronounced that it distorts the strengths and weaknesses of the Red Sox in the eyes of fans, and even in the eyes ol team management. Palmer maintains that the Red Sox teams of the late seventies and early eighties, conventionally thought of as power-hitting teams with mediocre pitching, were actually—as revealed in their statistics away from Fenway—defenseand pitching-oriented teams with a modicum of power; Fenway Park, he says, made the Red Sox hitters look better, and the pitchers look worse, than they actually were. James, who has suggested the same thing in his own writing, does not like to say it too loud—he is hesitant to tell 99 percent of baseball professionals and tans that they are blind—but he does think that such distortions can happen. He notes that the New York Mets always seem to be looking for hitters, and are often disappointed by the hitters they obtain, perhaps because Shea Stadium, a lousy hitter’s park, makes the Mets offense look worse than it actually is. Instead of seeking constantly to build up their offense, which is difficult to produce at Shea, he thinks the Mets management should take advantage ol their park’s poor visibility and build their team around power pitchers like the Mets stars of the past—Tom Seaver, Jerry Koosman, and Jon Matlack. The Mets organization has fielded two pennant-winning teams in its twenty-two-year history; Seaver and Koosman pitched for both of them, in 1969 and 1973, and Matlack pitched for the second.
A third theme running throughout James’s work (though never stated quite this explicitly) is that baseball teams are more likely to win when their players are treated not as numbers, as producers of statistics, but as feeling people with aspirations, personal needs, and unique abilities and limitations. In the early Abstracts, where James presents month-by-month batting statistics (a practice he abandoned when Ballantine began publishing his books), he notes many instances in which players seem to fade toward the end of the season—an affliction that is particularly noticeable, he says, among middle infielders, who tend to be slightly built compared with their teammates—and he comments several times on the need to give them time off for rest. He takes a dim view of the free-agent, meatmarket approach to assembling a team, arguing that it not only disrupts team play in the mechanical sense but also discourages the feeling of community and shared goals. He chides the San Francisco Giants for ruining the career of Dave Kingman by shuttling him willy-nilly from one position to another; they suggested to Kingman, James speculates, that he was a one-dimensional man, valuable only for his batting ability—a description that he has certainly lived up to in the years since.
James similarly criticizes the Chicago White Sox for poor-mouthing their shortstop Bill Almon, in order to win a salary arbitration case after Almon’s fine 1981 season. Almon, who now plays for the Oakland A’s, had a bad year in 1982, and James wonders if the reason wasn’t personal: “. . . almost everybody plays better,” he wrote, “when he feels that he is a part of something, rather than that he is on the spot to perform for somebody else’s benefit.” James even comes to the defense of umpires, in the 1979 Abstract. Discussing the umpires’strike of that year, in which one of the issues was vacation time, he wrote:
Being away from your family for 200 straight days is a hardship, a severe hardship. . . . It’s obvious that it isn’t necessary, and it should be equally obvious that where we have a clear and logical alternative, there is simply no justification for asking umpires to do something which tends to destroy their family life and induce ulcers, or even loneliness. So long as you have a reasonable option to treat men as humans who have needs rather than workers who provide services, you do. And we should.
It is probably a mark of my own prejudice more than anything else, but I was surprised the first few times I encountered this attitude in James’s work, just as I was surprised that he had studied English in college, rather than something like engineering, and by the obvious relish with which he observes the odd incidentals of baseball— Hal McRae’s comically choppy stride, Frank White’s perpetual smile, Jerry Dvbzinski’s nervous pursuit of imaginary ground balls between batters: the little touches of personality by which players reveal that they are more than the sum of their statistics. There was no room for such sentiments in my preconception of the ultimate baseball-numbers freak—the scientist of baseball, as I had come to think of James—and I asked him in several different ways, on several occasions, to explain away the contradiction. Time after time he tried to make me understand that, in his mind, the contradiction simply did not exist.
“That’s one of the most essential things,” he told me. “To me, all of these numbers are just like words. They all mean something. They define skills, they draw limits. The unique thing about baseball statistics is that, because of the existence of standards, they have this subtle and diverse ability to convey images. I don’t think I imagine this: Minnie Minoso” (one of James’s favorites when he was a boy)“—his playing style, his personality—is reflected in the records. This is more true in baseball than in anything else—the records reflect personality. It’s quite true that they do it perhaps inaccurately, that they do it imperfectly, but nonetheless, they do it.”
So clear are the images that baseball numbers can convey, James said, that as a child he was able to invent imaginary ballplayers from lines of statistics. “Did you ever read that Robert Coover novel Tire Universal Baseball Association? Well, I didn’t create mythic characters by staging games the way J. Henry Waugh did, but from early childhood I’ve had his love of creating careers and records through numbers.” The hero of Coover’s novel played a table game of the sort that is familiar to hard-core fans of -baseball and its numbers; a set of three dice determined the events of his imaginary ball games, and over time, as his made-up players accumulated records, they took on the qualities of real, breathing people—at least in J. Henry Waugh’s mind. James’s methods were only slightly different. In his high school study halls, for example, he would commandeer the daily newspaper—to the dismay of the presiding teacher—and write down the one-game records of, say, every catcher whose team had won its game the day before. He would add these records together, pretending that they represented the performance of a single catcher, and if he continued the process long enough, the resulting numbers would begin to take on a life of their own. From the statistics produced by many different catchers, James would invent a wholly new catcher, one whose record—and thus personality—was like that of no other.
“Not only for me and J. Henry Waugh,” James said, “but for many, many other people, these little numbers generate images that make them capable of creating fiction. I could sit here and, with these books and papers, create a career for someone who never existed.”
I asked James if he would create someone for me while I sat there at his desk. “I can give you a very brief example,” he said. He picked up a copy of USA Today—it was already opened to the box scores, of course—and laid out the rules of play: “If we take all the first basemen here from games in which four or more runs were scored—let’s make it three or more runs—and start compiling a record for them . . .” He took up a pen, opened his spiral notebook to a clean page, and went to work.